PHP编程
phpStudy vscode 搭建debug调试的教程详解
发布时间:2022-04-16 发布网站:脚本宝典
脚本宝典收集整理的这篇文章主要介绍了phpStudy vscode 搭建debug调试的教程详解,脚本宝典觉得挺不错的,现在分享给大家,也给大家做个参考。
下载地址
phpstudy:https://www.xp.cn/download.html
vscode:https://code.visualstudio.com/ 设置
phpstudy版本:7.3.4nts
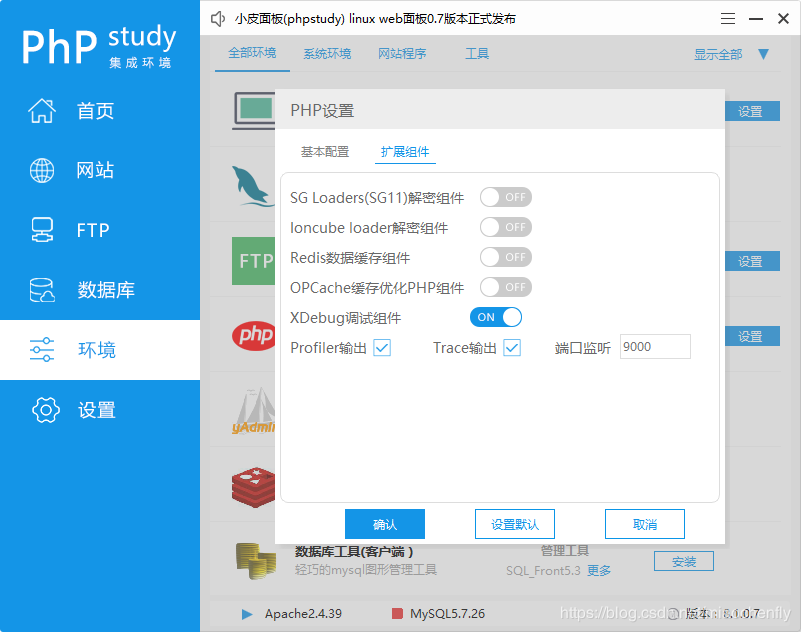
[Xdebug]
zend_extension=D:/phpstudy_pro/Extensions/php/php7.3.4nts/ext/php_xdebug.dll
xdebug.collect_params=1
xdebug.collect_return=1
xdebug.auto_trace=On
xdebug.trace_output_dir=D:/phpstudy_pro/Extensions/php_log/php7.3.4nts.xdebug.trace
xdebug.profiler_enable=On
xdebug.profiler_output_dir=D:/phpstudy_pro/Extensions/php_log/php7.3.4nts.xdebug.profiler
xdebug.remote_enable=On
xdebug.remote_autostart=On
xdebug.remote_host=localhost
xdebug.remote_port=9000
xdebug.remote_handler=dbgp
vscode :
ctrl+,调出setting,或则文件->首选项->设置
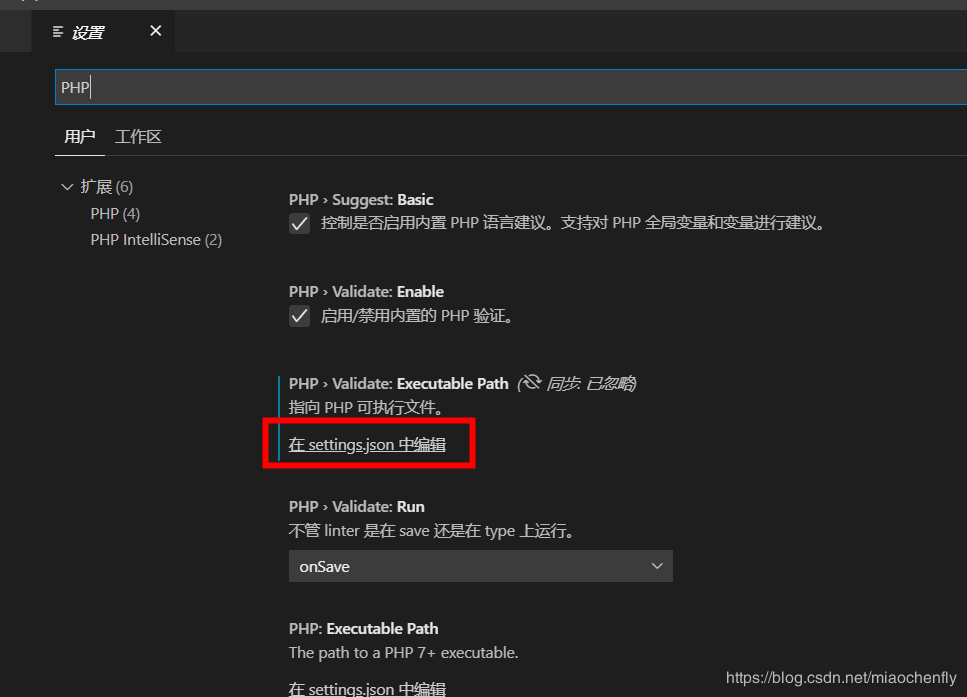
php路径设置
{
  "window.zoomLevel": 1,
  "git.confirmSync": false,
  "git.autofetch": true,
  "[javascript]": {
    "editor.defaultFormatter": "vscode.typescript-language-features"
  },
  //关键点
  "php.validate.executablePath": "D:/phpstudy_pro/Extensions/php/php7.3.4nts/php.exe"
}
Xdebug设置
{
  // 使用 IntelliSense 了解相关属性。
  // 悬停以查看现有属性的描述。
  // 欲了解更多信息,请访问: https://go.microsoft.com/fwlink/?linkid=830387
  "version": "0.2.0",
  "configurations": [
    {
      "name": "Listen for XDebug",
      "type": "php",
      "request": "launch",
      //端口
      "port": 9000
    },
    {
      "name": "Launch currently open script",
      "type": "php",
      "request": "launch",
      "program": "${file}",
      "cwd": "${fileDirname}",
      //端口
      "port": 9000
    }
  ]
}
验证
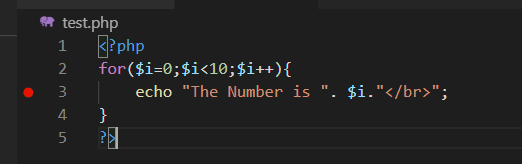
vscode F5启动调试
浏览器输入:localhost/test.php

到此这篇关于phpStudy vscode 搭建debug调试的教程详解的文章就介绍到这了,更多相关phpStudy vscode 搭建debug调试内容请搜索脚本宝典以前的文章或继续浏览下面的相关文章希望大家以后多多支持脚本宝典!
您可能感兴趣的文章:
脚本宝典总结
以上是脚本宝典为你收集整理的phpStudy vscode 搭建debug调试的教程详解全部内容,希望文章能够帮你解决phpStudy vscode 搭建debug调试的教程详解所遇到的问题。
本图文内容来源于网友网络收集整理提供,作为学习参考使用,版权属于原作者。
如您有任何意见或建议可联系处理。小编QQ:384754419,请注明来意。
猜你在找的PHP编程相关文章
- 怎么将网站的php版本信息隐藏起来 2022-05-15
- 新版php study根目录下文件夹无法显示的图文解决方法 2022-04-16
- php项目接入xxl-job调度系统的示例详解 2022-04-16
- PHP基础用法讲解及phpinfo();演示 2022-04-16
- php实现ffmpeg处理视频的实践 2022-04-16
- PHP随机生成用户信息实例分析 2022-04-16
- php封装pdo实例以及pdo长连接的优缺点总结 2022-04-16
- php中echo、print和print_r的区别点及用法总结 2022-04-16
- php缓存的类型总结及用法 2022-04-16
- PHP中最低级别的错误类型总结 2022-04-16
全站导航更多
html5HTML/XhtmlCSSXML/XSLTDreamweaver教程Frontpage教程心得技巧JavaScriptASP.NETPHP编程正则表达式AJAX相关ASP编程JSP编程编程10000问CSS/HTMLFlexvbsDOS/BAThtahtcpythonperl游戏相关VBA远程脚本ColdFusionMsSqlMysqlmariadboracleDB2mssql2008mssql2005SQLitePostgreSQLMongoDB星外虚拟主机华众虚拟主机Linuxwin服务器FTP服务器DNS服务器Tomcatnginxzabbix云和虚拟化bios系统安装系统系统进程Windows系列LINUXRedHat/CentosUbuntu/DebianFedoraSolaris红旗Linux建站经验微信营销网站优化网站策划网络赚钱网络创业站长故事alexa域名photoshop教程摄影教程Fireworks教程CorelDraw教程Illustrator教程Painter教程Freehand教程IndesignSketch笔记本主板内存CPU存储显卡显示器光存储鼠标键盘平板电脑安全教程杀毒防毒安全设置病毒查杀脚本攻防入侵防御工具使用业界动态Exploit漏洞分析
最新PHP编程教程